Functional Charts
Audience:
Audience: Administrators
Overview
Functional Charts (also known as Placeholder Charts ) allow you to display system-generated boxes that describe the functions of an organization. For example, rather than just displaying the employee hierarchy of the company, administrators can display placeholders, which employees will roll up to based on the field-defined function (i.e. Department).
Administrators can create Functional Master Charts in the Chart Settings: Source panel.
The following article provides step-by-step instructions for creating a Functional Chart.
Accessing Functional Charts
Log in to OrgChart.
Click on the Mode Switcher icon in the Top Toolbar, and then select the Setup option. The Setup panel is displayed.
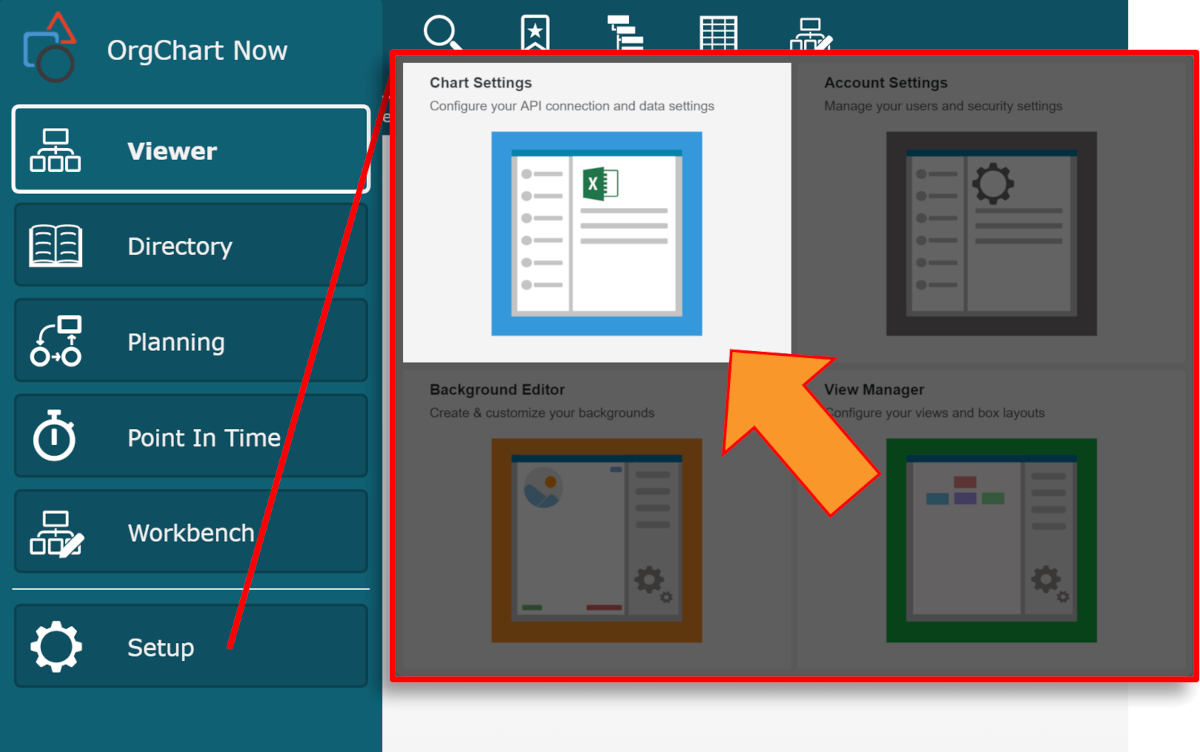
Click on the Chart Settings tile, and then scroll down to the bottom of Source the panel.
Check the Placeholder Chart checkbox (under the Top Box heading). Three Function dropdown menus appear.
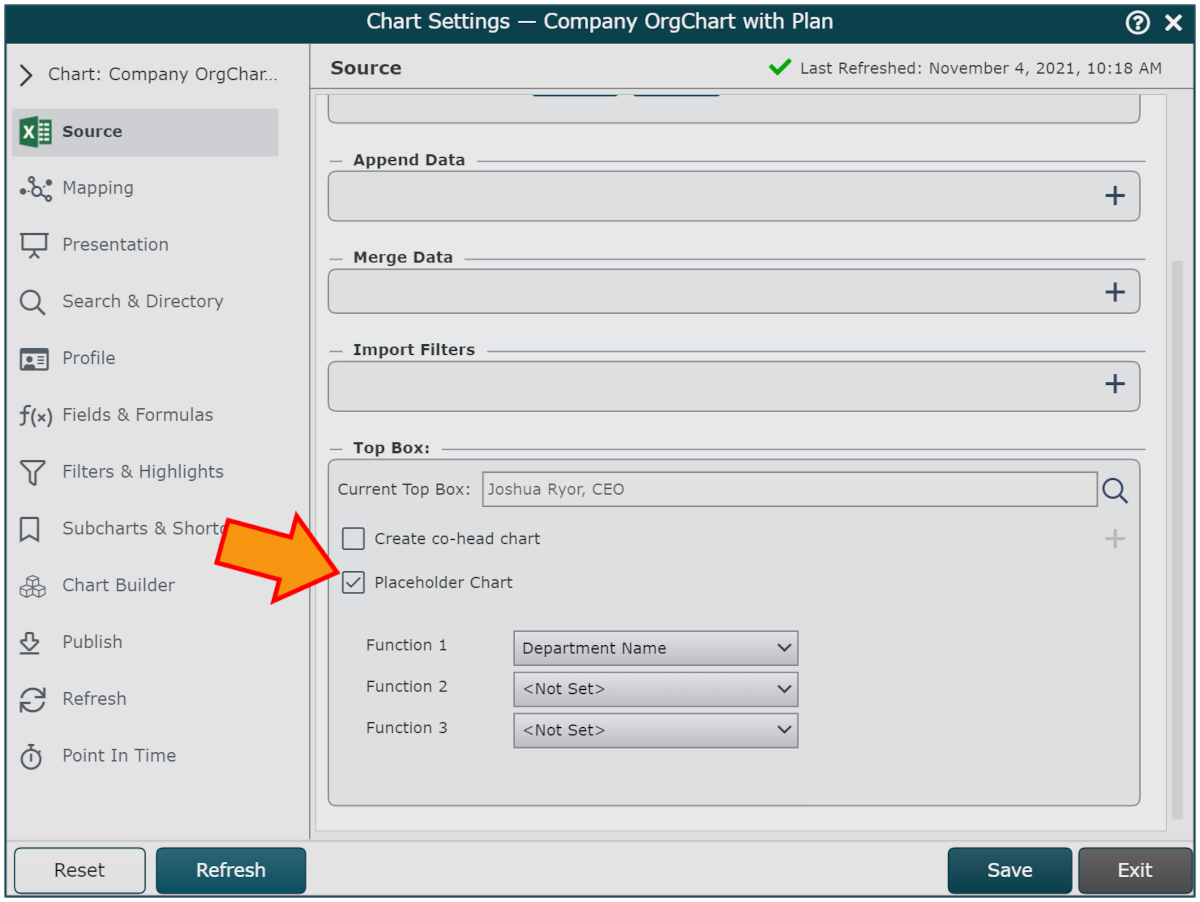
Select a field form the first Function dropdown menu.
Note
You may select up to three Functions to drive the Placeholder Chart. Reference the Multi-Layer Functional Charts section below for more information.
Important
In order to use this feature, all employee records must have a value populated for the selected functional field(s).
Click Save and Refresh.
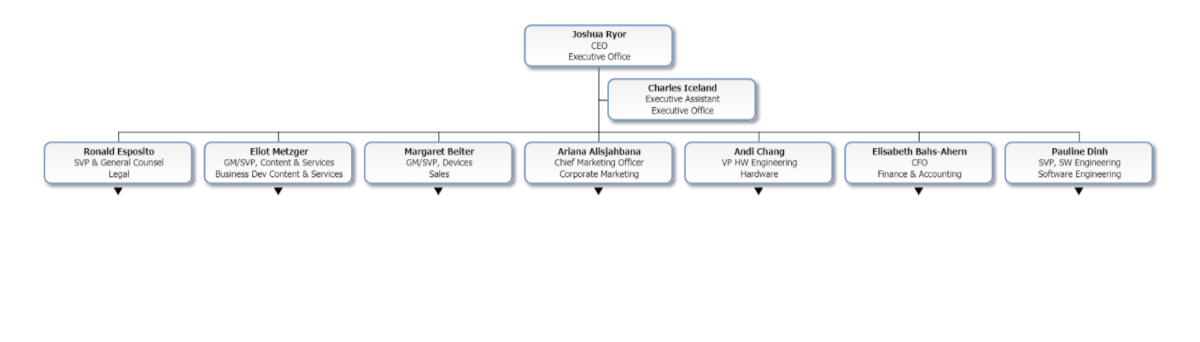
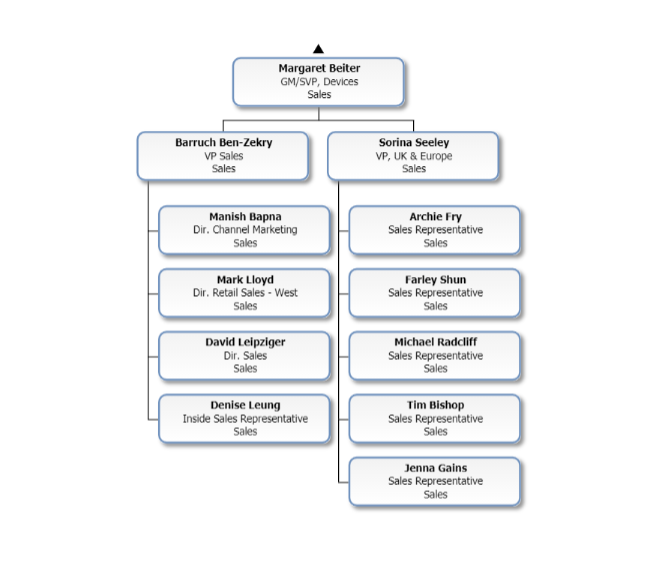
Without Functional Chart
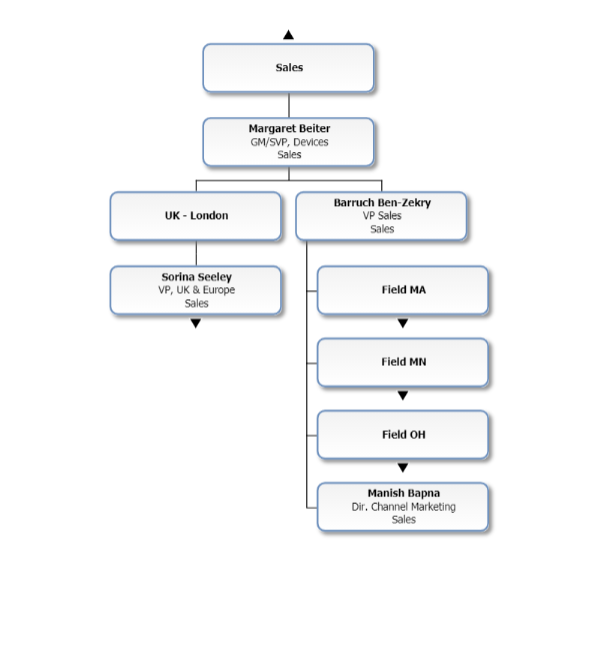
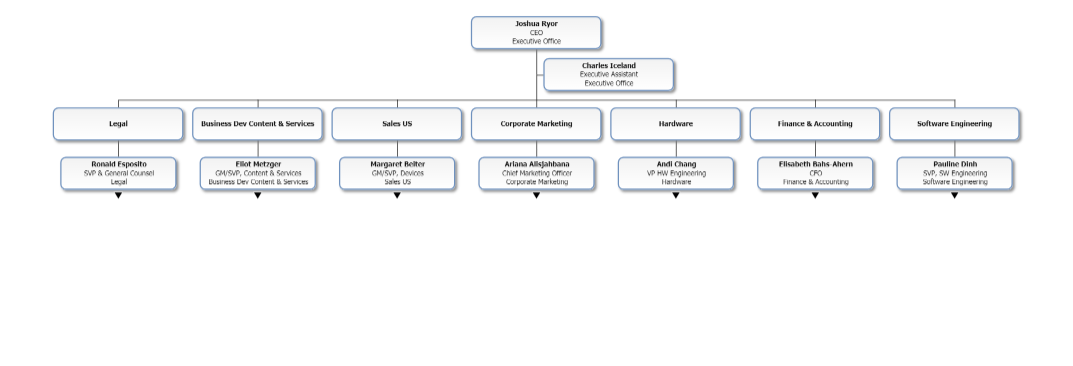
With Functional Chart
Note
Administrators and Read/Write users can apply conditional formatting to Placeholders by using the following Basic Rule structure: Field ObjType Equals the Value Function. Reference the article Rule-Driven Charting Example for more information about conditional formatting.
Multi-Layer Functional Charts
It is possible to create a Functional Chart that is supported by more than one function. For example, you may want employees to roll up to their departmental function, as well as their location. The following section provides step-by-step instructions for generating a Multi-Layer Functional Chart.
Log in to OrgChart.
Click on the Mode Switcher icon in the Top Toolbar, and then select the Setup option. The Setup panel is displayed.
Click on the Chart Settings tile, and then scroll down to the bottom of the Source panel.
Check the Placeholder Chart checkbox (under the Top Box heading). Three Function dropdown menus appear.
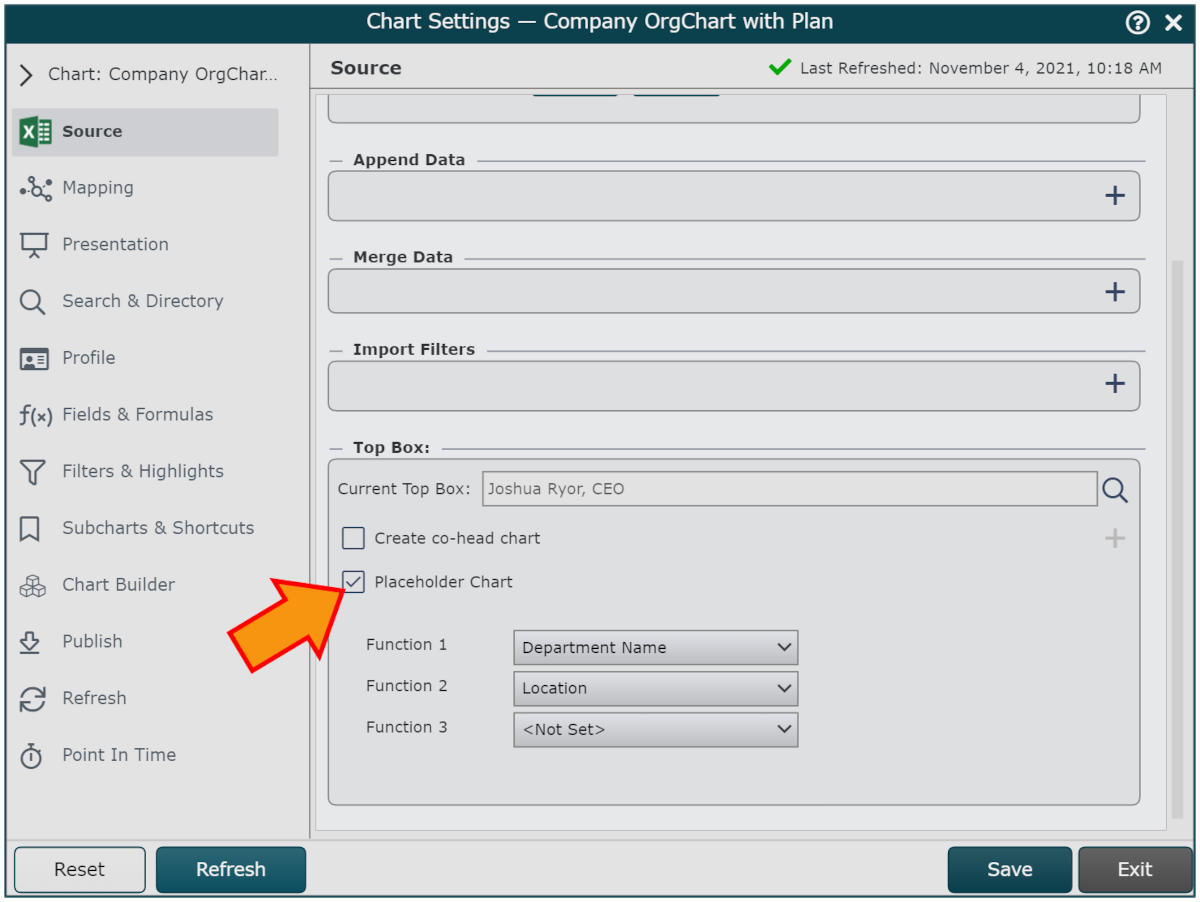
Select a field from the first Function dropdown menu.
Select an additional field from the second Function dropdown menu.
Click Save and Refresh.
Without Multi-Layer Functional Chart:
With Multi-Layer Functional Chart