Point in Time
Audience
Audience: Administrators Edition: Enterprise
Overview
Point-in-Time allows Administrators and end users with the the proper access to load manually and automatically archived charts, which display the structure of your organization on a specific date.
Point-in-Time charts are useful for regulatory, legal, and workforce analytics requirements. For example, a SOX compliance auditor has the legal right to request an organizational chart from a specific date.
The following article provides information for accessing and loading archived charts.
Administrators can configure the Point in Time settings, such as archiving frequency, in the Chart Settings: Point in Time menu.
Accessing Archived Charts
Click on the Mode Switcher icon in the Top Toolbar, and then select the Point in Time option from the dropdown menu.
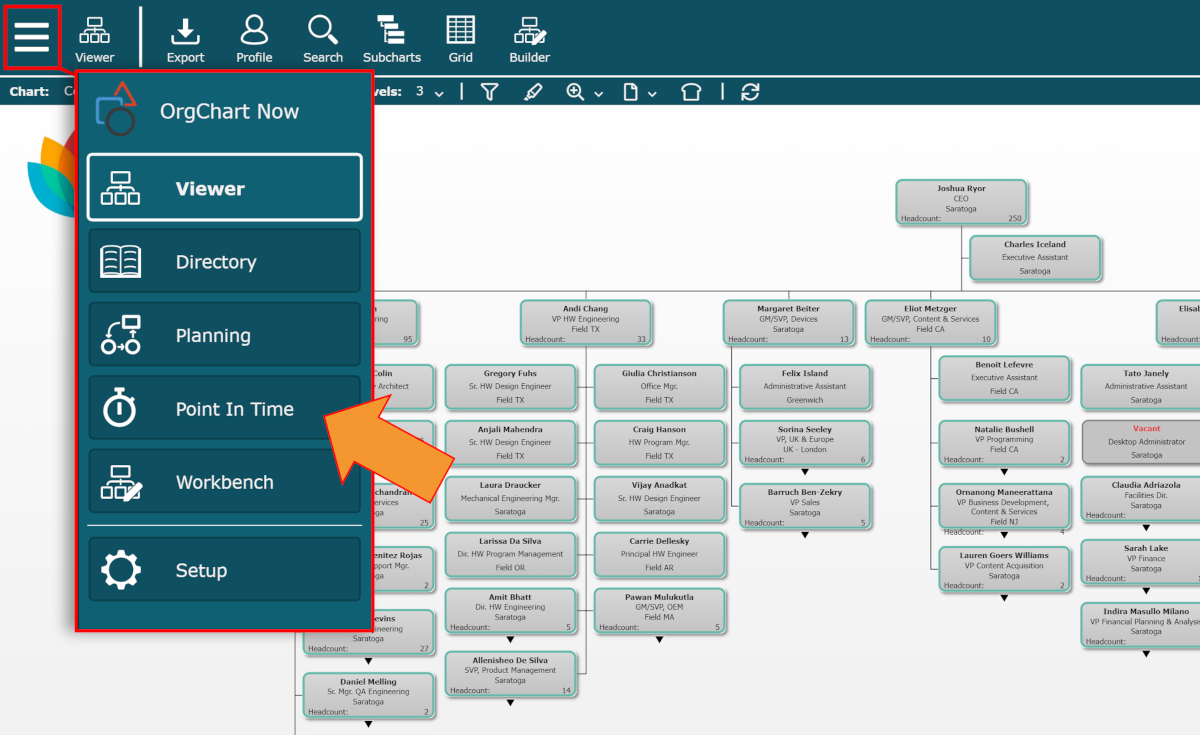
The Point in Time panel containing all of the archived charts in your account is displayed.
Note
End-users must be assigned an Access Group which allows access to the Point in Time module in order to load archived charts.
Loading Archived Charts
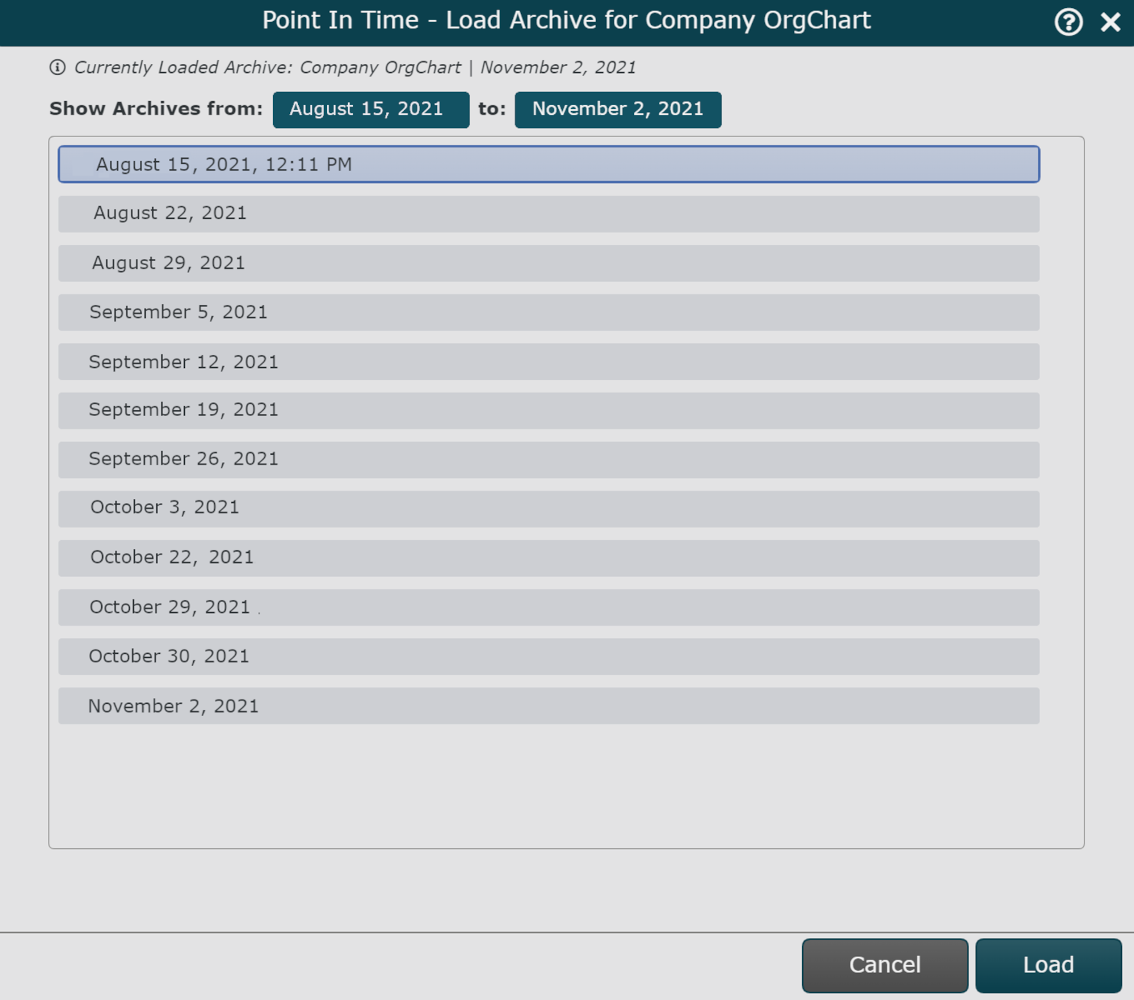
Once the Point in Time archive is displayed, follow these steps to load a a snapshot of your organization on the specified date:
Click to highlight an archive entry, and then click on the Load button. The Snapshot Builder is displayed.
Click on the search button to search for and select the employee who should be at the top of the chart.
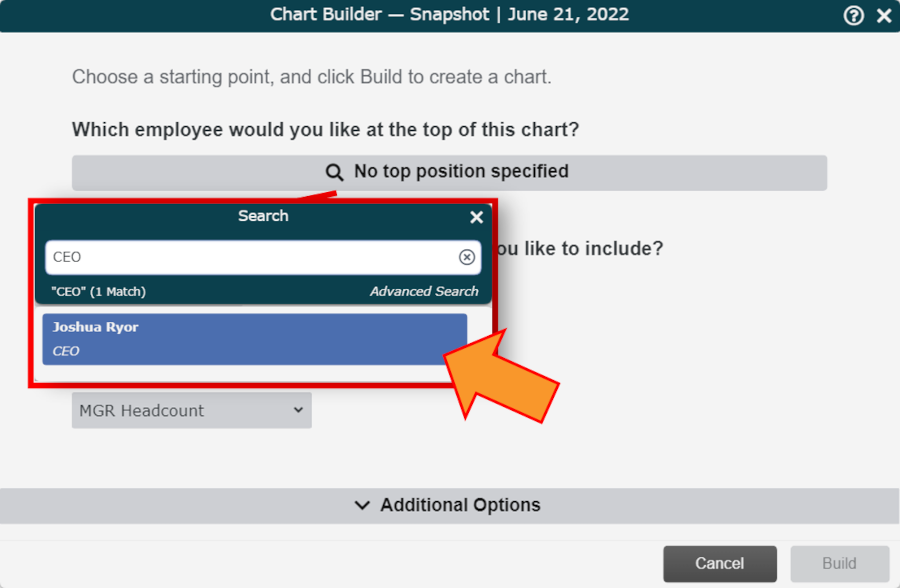
Click on the Levels dropdown menu (under the How many levels under this employee would you like to include? prompt), and then select how many organizational levels beneath the top employee to include in the generated snapshot.
Click on the View dropdown menu (under the What view would you like to apply? prompt), and then select the View to apply to the snapshot.
Note
Administrators can modify the Views that are available to apply in the Chart Settings: Chart Builder panel.
Optionally, configure other settings using the Additional Options.
Click on Go. The snapshot of archived data is generated in Workbench.
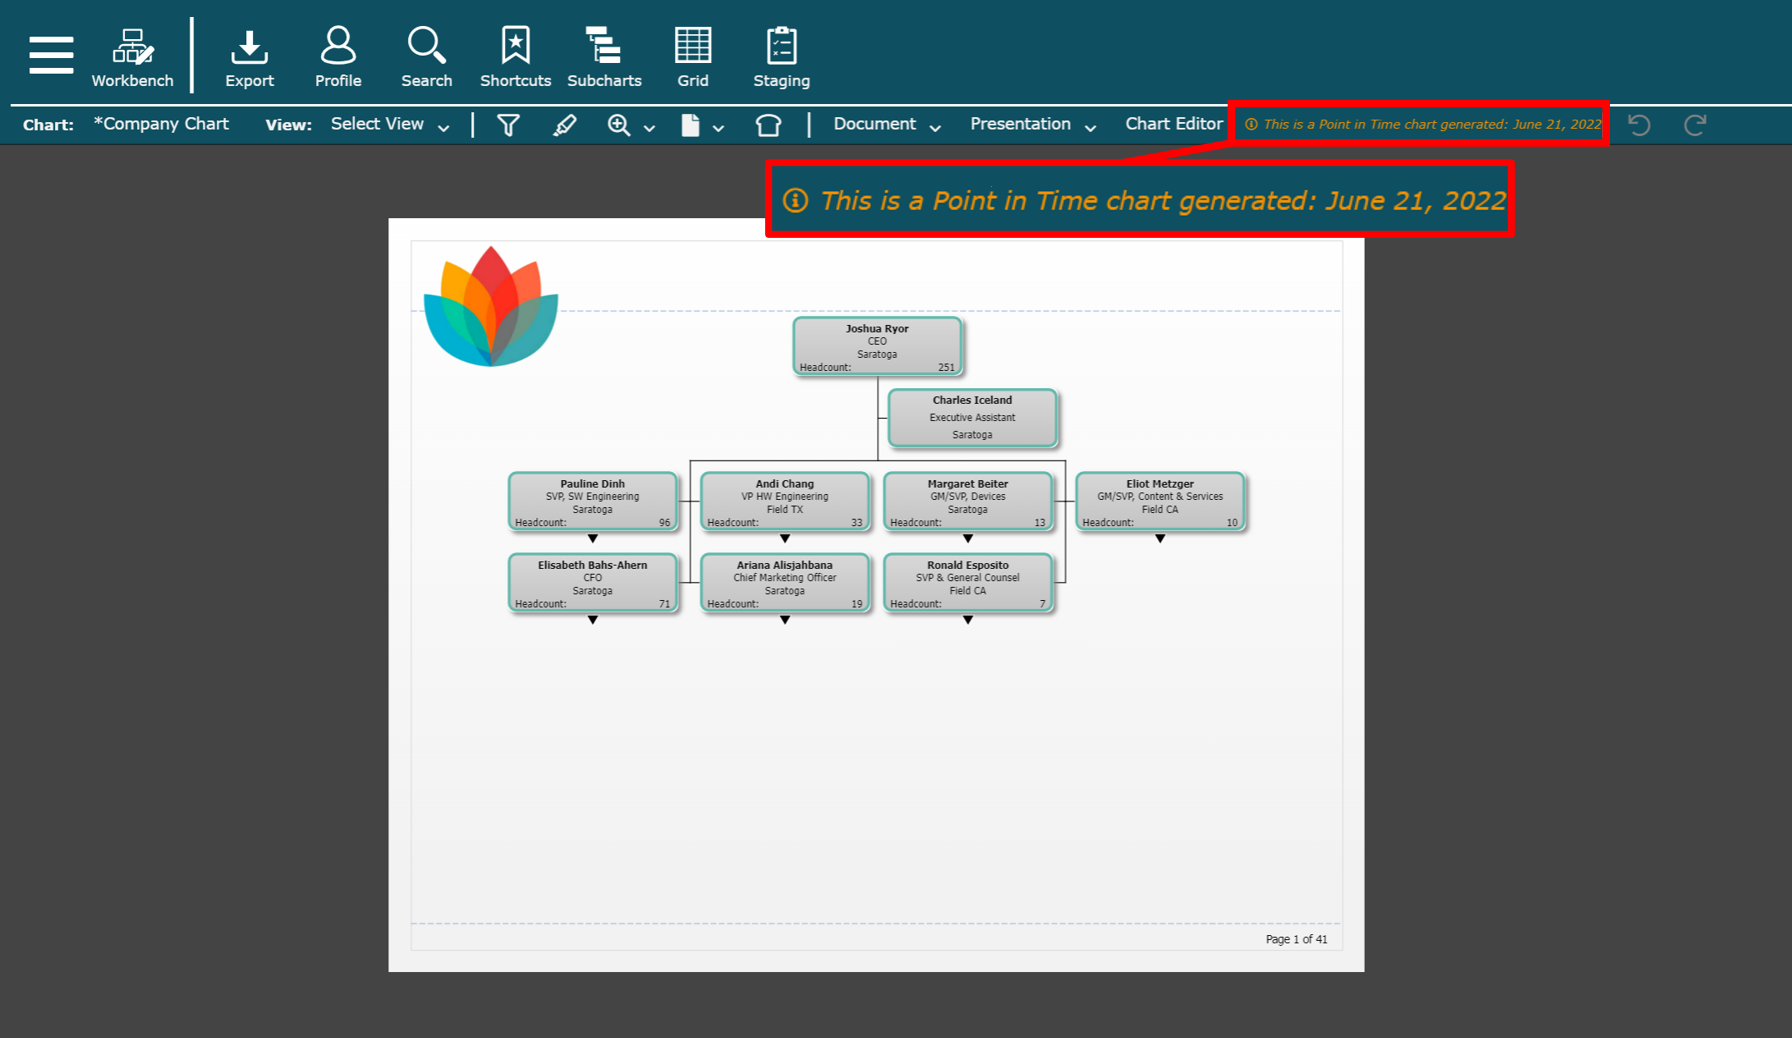
Point in Time Snapshot
Below is a chart document (Snapshot) generated from archived chart data.